

Until the lockdown.
But what happens when automation experts are confined at home in the middle of a pandemic crisis?
Here is where our journal from the #italylockdown took an unexpected path.
FIGHTING THE VIRUS, WITH DATA
During a crisis there are two things which can never go out of sight:
- Retrieve and count only on reliable information and reliable data sources: it’s a mechanism we are all familiar with nowadays. Fake news is around the corner, but during a pandemic we really need to fight them, because damages could be uncountable
- Be useful: the covid19 emergency is pretty one of its kind. We are confined at home, but we have the power to reach a huge audience thanks to social media and digital channels. Let's use this power for good.
How did it translate for us?
On March 7th, the Civil Protection started making data about the spread of the virus in Italy available in open format on GitHub. Dataset includes:
- National trend
- JSON data
- Provinces data
- Regions data
- Summary cards
- Lockdown Areas
Few minutes after the conference, data are published on GitHub and published on an institutional dashboard, reporting basic data.
But what if I want to access the complete set of data in a clear, easy to understand way, that allows to understand trends, situation in specific regions and have the data always available?
Combining the power of HCL Workload Automation with these data and Google Data Studio dashboards was the natural next step.
AUTOMATION ENHANCED DATA ANALYSIS
A few hours after data were made available by the Civil Protection, we created an analysis dashboard to let everybody follow and track the impact of the corona virus in Italy: click here.
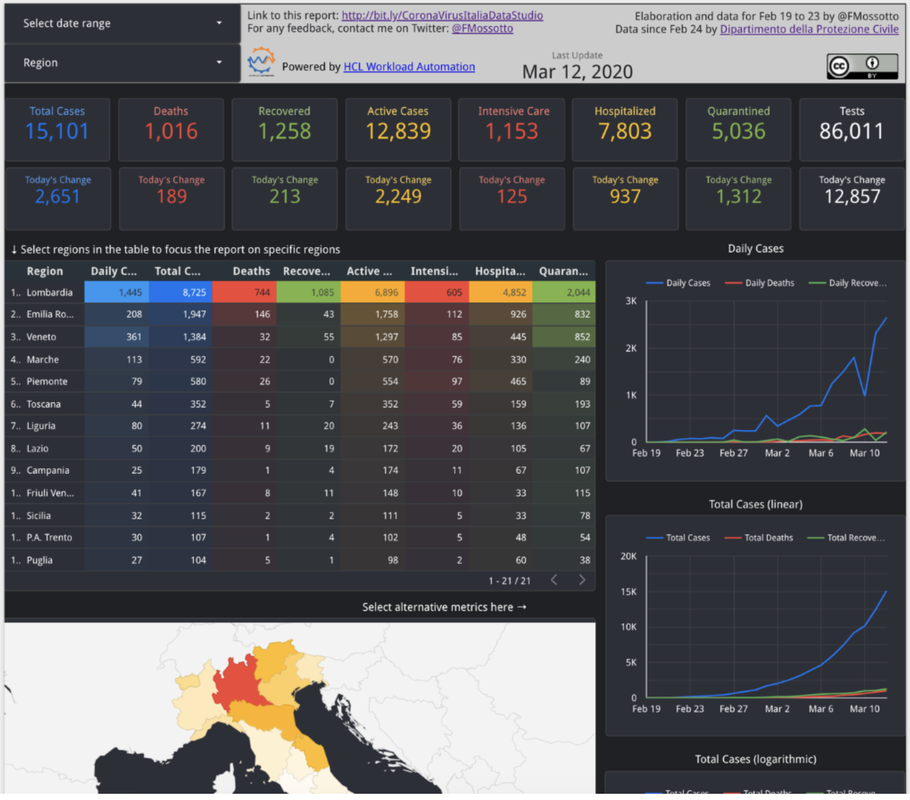
MAKE SENSE FROM DATA
- How and where is the virus spreading?
- Which is the trend for active cases?
- Which is the death number
- What’s the impact on Intensive Care Units in each region?
Google Data Studio was perfect for this scope.
AUTOMATED DATA ANALYSIS
Second need: Getting the data form the official source, integrate the data, elaborate the data and publish them requires different steps and different tools, people come on the dashboard right after 6 PM CET to check how the trends are changing, if we want this to be efficient, we need to put wings on it with an automation tool.
That’s exactly our expertise: HCL Workload Automation was our most powerful ally on the field.
As we were saying the process of publishing data is made of several steps:
- Data are published by Civil Protection on GitHub after the 6 PM CET press conference, it can be minutes or hours later depending on the day.
- When published, data are
- Extracted on server
- Merged with data we keep for the first days of the spread, when Civil Protection was not collecting yet the data
- Published on our personal GitHub repo
- At this point a Google Spreadsheet is used to elaborate the data, at this point:
- It needs to reload the data from our GitHub repo
- Formula need to be extended to new cells in order to cover the new additional data
- Google Data Studio needs to load the new data from the spreadsheet tables
Too many steps and too much expectation on refresh to happen quickly, running that manually was not an option, also considering that we are also still working at that time. Owning HCL Workload Automation, we have automation in our DNA and the availability of the right tool. So we have created our Job Stream, with 3 Executable jobs and a RESTful job
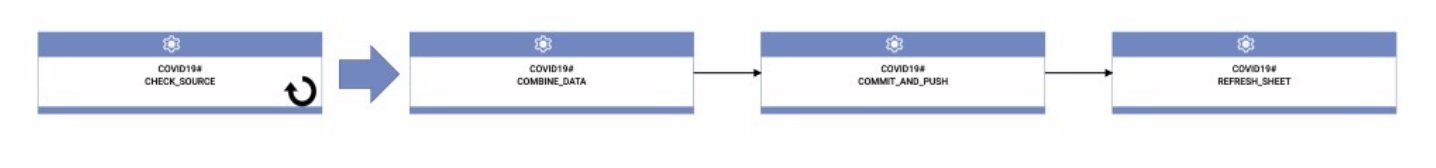
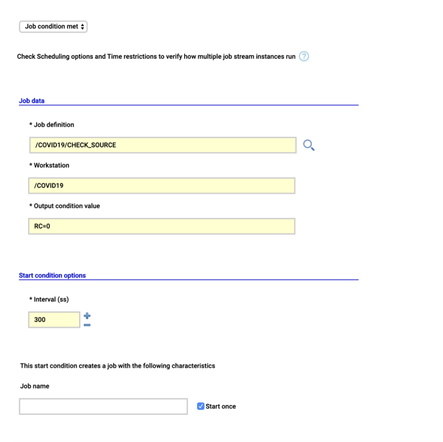
The first job CHECK_SOURCE runs the check_submodule.sh script that runs git pull and a git submodule update to download the latest updates from the Civil Protection repository, it then checks for the existence of the file with the today’s date, it exits with RC 0 only in this case. This is used in a “Job condition met” Start Condition for the Job Stream, set to retry every 5 until the script exits with RC=0. We expect one update per day, so we have checked “Start once” option. The script accept a single parameter with the today’s date in order to perform the check, we use the ${tws.plan.date} to pass the job stream sched date.
Then the COMMIT_AND_PUSH data uses git command line to commit the changes and pushing that on our repository on GitHub.
At this point we have to update the Google Spreadsheet, the script to reload data and extend formulas runs in Google Apps Scrips running on Google Cloud. In order to call it from HCL Workload Automation we had leveraged the possibility of Apps Scripts to be exposed over https implementing the doGet function. The REFRESH_SHEET job is a RESTful job that calls the GET on Apps Script and receive back the result, in our case we just need it the joblog for troubleshooting, but it’s also possible to extract variables from the result and use them in next jobs. Of course, the whole environment (Master, DWC and agent) runs in containers using dockercompose.
IS IT REALLY USEFUL?
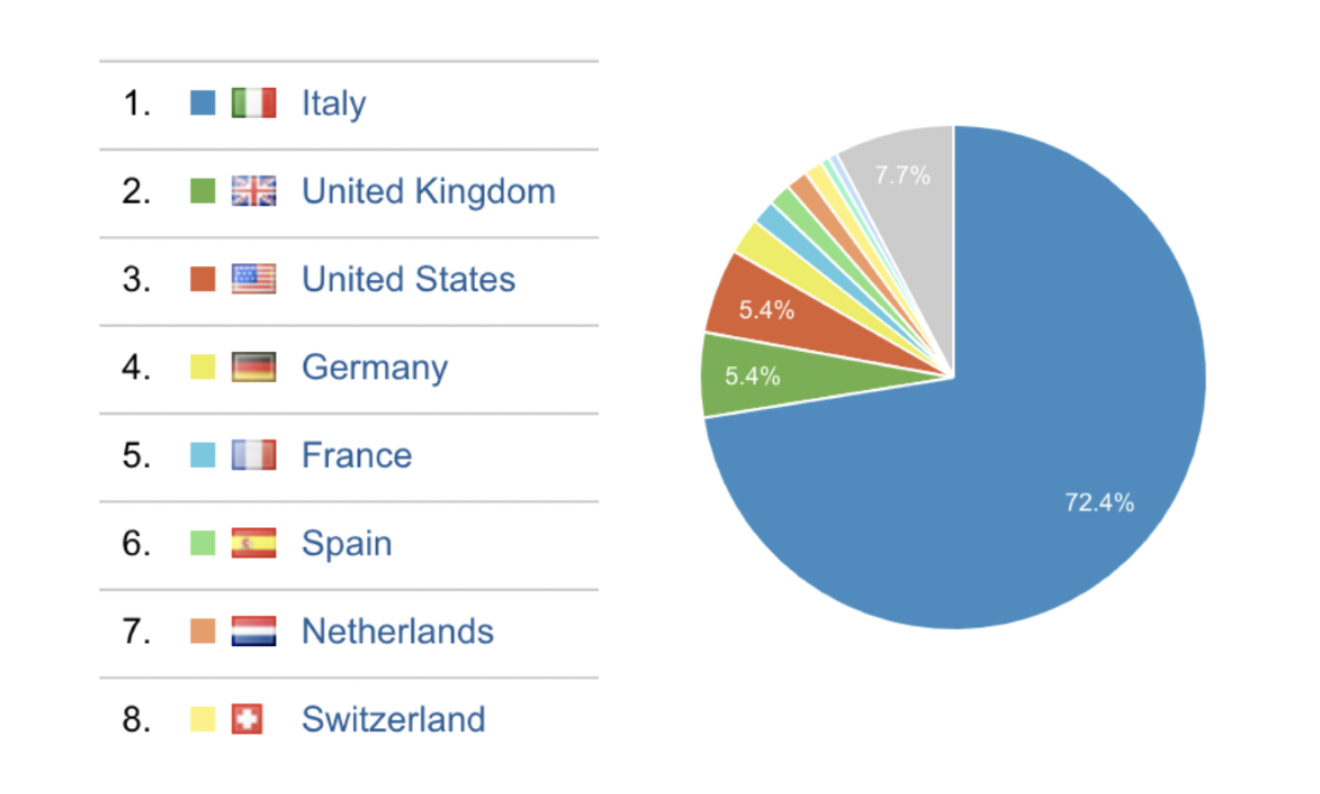
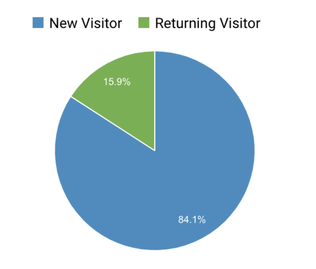
It is. And not just for Italians. According to usage data, people comes from all over the world. There is of course a bigger traffic from Italy, but other countries very close to ours and currently facing a similar situation as the one we had some weeks ago, are looking at these data:
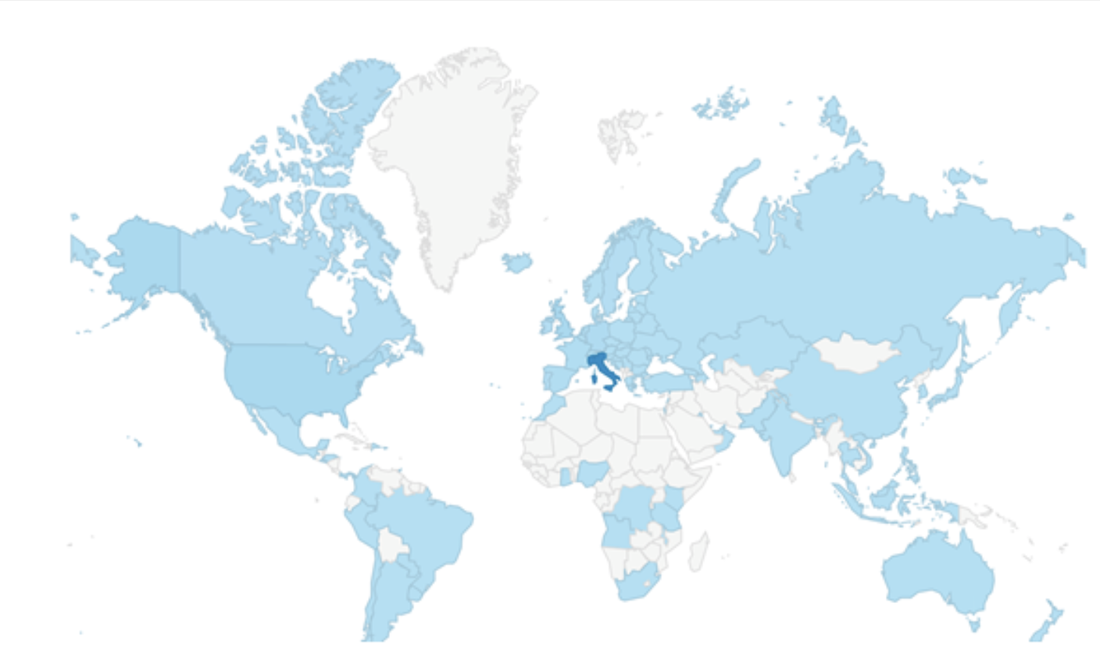 |  |
 | We really hope this can be useful to many people. So, take a look by yourself here http://bit.ly/CoronaVirusItaliaDataStudio and let’s help us spread the word: data can fight the fake news and raise awareness for other countries. We are all in this together. Stay at home, stay safe. |
 | FRANCO MOSSOTTO |

 | EMANUELA ZACCONE |